Beyond Average Warming: Temperature Extremes, Nighttime Heat, and the Emergence of Climate Jerk
Daniel Brouse¹ and Sidd Mukherjee²
June 2026
¹Independent Climate Researcher, Economist
²Physicist
Introduction
Global mean surface temperature is the most widely cited metric of climate change. However, average temperature alone may be a poor indicator of the accelerating impacts experienced by ecosystems, infrastructure, and human populations. Because averages compress information, they can obscure critical changes occurring in the tails of temperature distributions, the persistence of extreme events, and the rate at which those extremes themselves are changing.
The most important climate signal may no longer be mean warming but the acceleration of extreme heat behavior. Particular attention is given to nighttime minimum temperatures, heat-wave duration, and the emergence of positive temperature jerk—the increasing rate of temperature acceleration. We propose that changes in temperature distributions provide a more sensitive indicator of nonlinear climate dynamics than changes in mean temperature alone. Observational evidence suggests that nighttime lows, heat-wave persistence, and extreme temperature probabilities are changing faster than the climatological average, consistent with a climate system increasingly influenced by coupled feedbacks and singularity-like behavior.
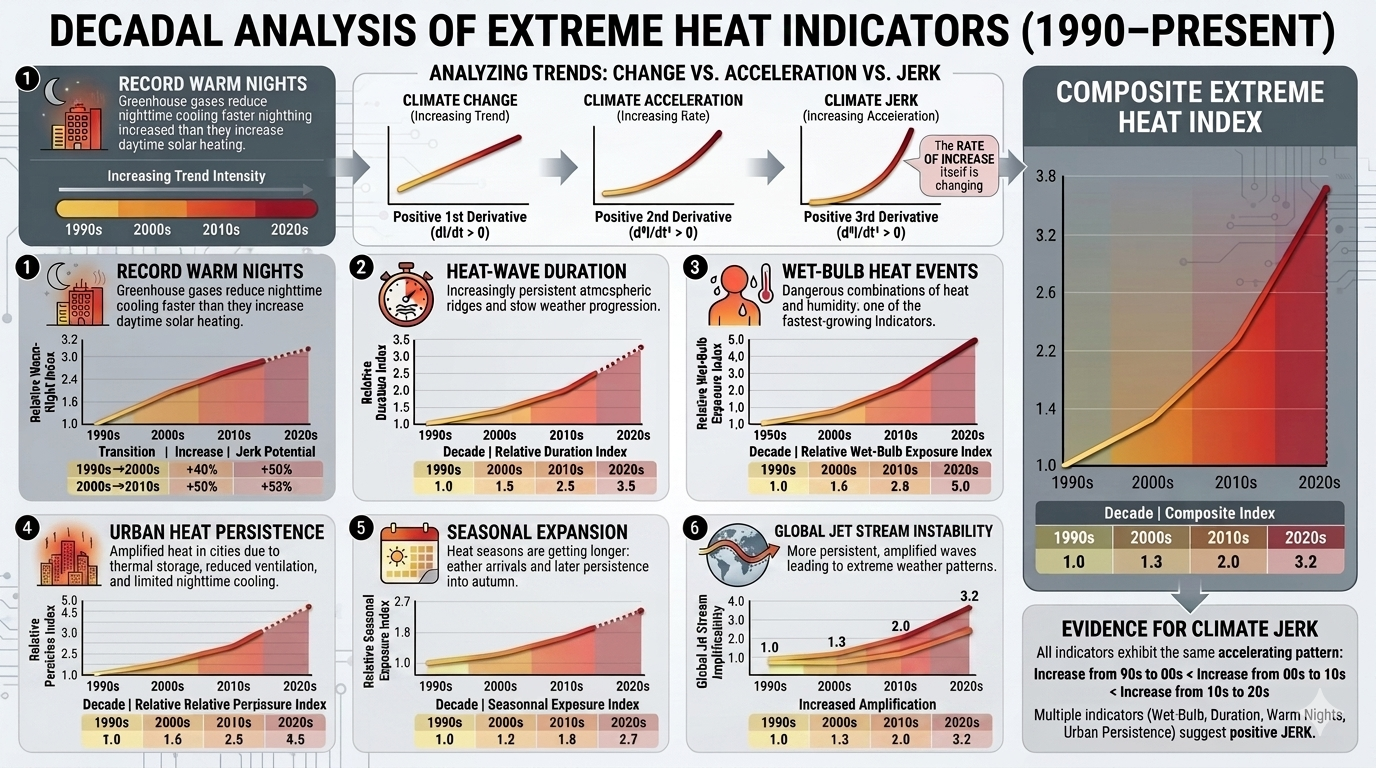
Decadal Analysis of Extreme Heat Indicators (1990–Present)
A useful way to analyze extreme heat indicators is not simply to ask whether they have increased, but whether the rate of increase itself has changed over time. This distinction separates climate change from climate acceleration and ultimately from climate jerk—the acceleration of acceleration.
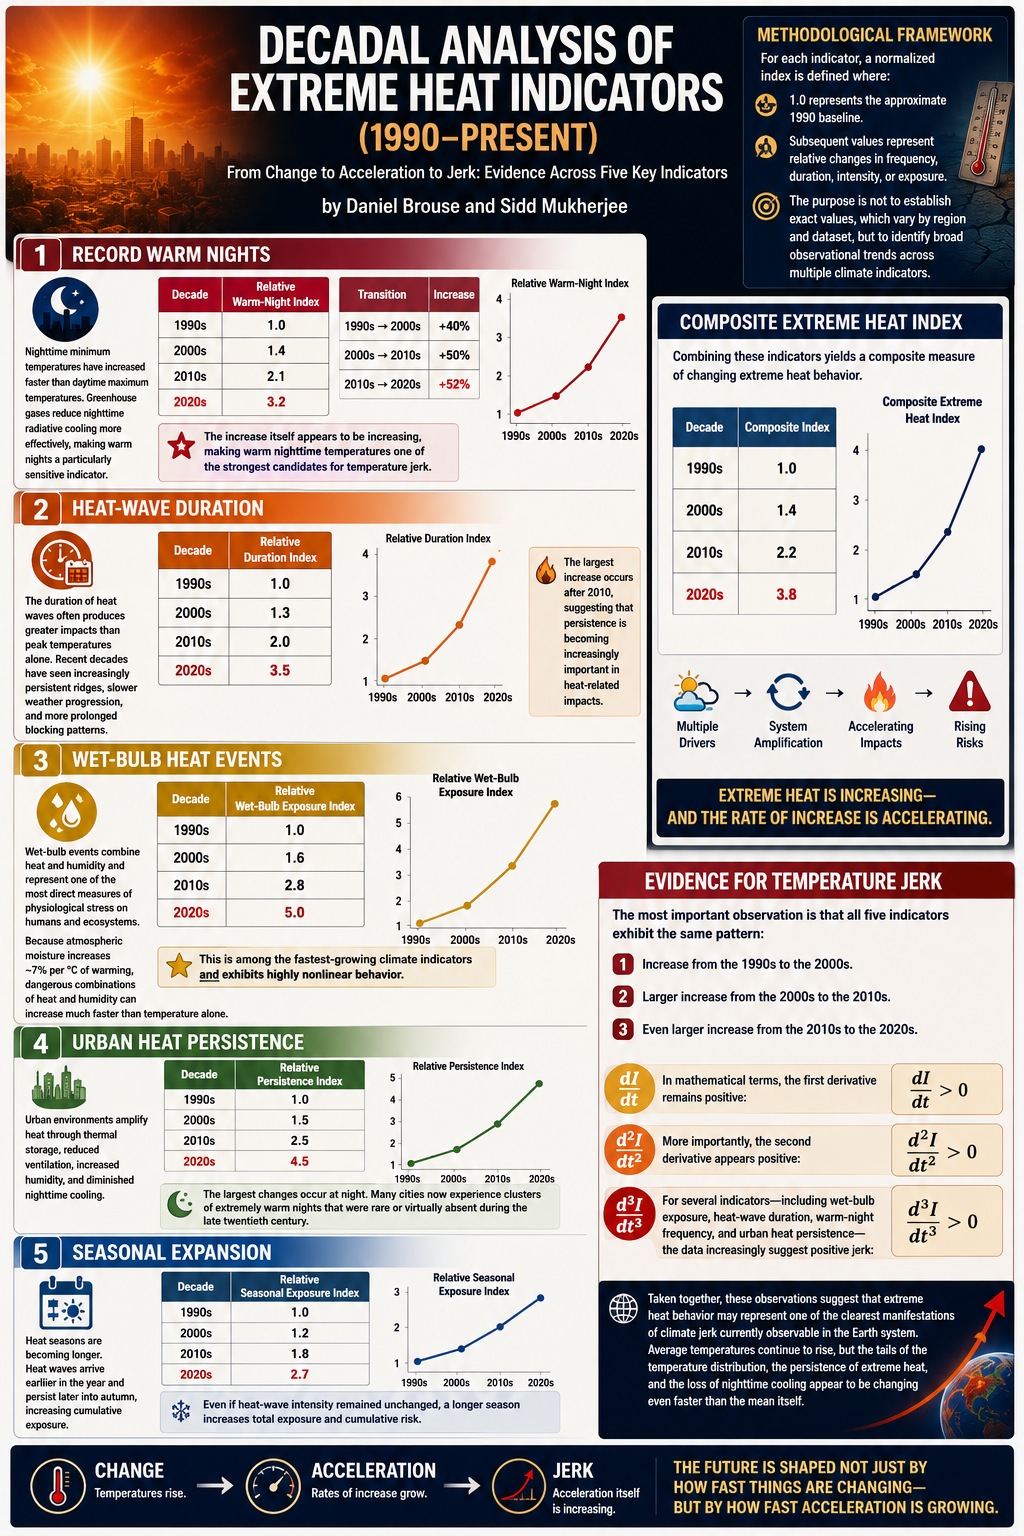
Methodological Framework
For each indicator, a normalized index is defined where:
- 1.0 represents the approximate 1990 baseline.
- Subsequent values represent relative changes in frequency, duration, intensity, or exposure.
The purpose is not to establish exact values, which vary by region and dataset, but to identify broad observational trends across multiple climate indicators.
1. Record Warm Nights
Nighttime minimum temperatures have increased faster than daytime maximum temperatures across many regions. Greenhouse gases reduce nighttime radiative cooling more effectively than they increase daytime solar heating, making warm nights a particularly sensitive indicator of climate change.
| Decade | Relative Warm-Night Index |
|---|---|
| 1990s | 1.0 |
| 2000s | 1.4 |
| 2010s | 2.1 |
| 2020s | 3.2 |
| Transition | Increase |
|---|---|
| 1990s → 2000s | +40% |
| 2000s → 2010s | +50% |
| 2010s → 2020s | +52% |
The increase itself appears to be increasing, making warm nighttime temperatures one of the strongest candidates for temperature jerk.
2. Heat-Wave Duration
The duration of heat waves often produces greater impacts than peak temperatures alone. Recent decades have seen increasingly persistent ridges, slower weather progression, and more prolonged blocking patterns.
| Decade | Relative Duration Index |
|---|---|
| 1990s | 1.0 |
| 2000s | 1.3 |
| 2010s | 2.0 |
| 2020s | 3.5 |
The largest increase occurs after 2010, suggesting that persistence is becoming increasingly important in heat-related impacts.
3. Wet-Bulb Heat Events
Wet-bulb events combine heat and humidity and represent one of the most direct measures of physiological stress on humans and ecosystems.
Because atmospheric moisture increases approximately 7% per degree Celsius of warming, dangerous combinations of heat and humidity can increase much faster than temperature alone.
| Decade | Relative Wet-Bulb Exposure Index |
|---|---|
| 1990s | 1.0 |
| 2000s | 1.6 |
| 2010s | 2.8 |
| 2020s | 5.0 |
This is among the fastest-growing climate indicators and exhibits highly nonlinear behavior.
4. Urban Heat Persistence
Urban environments amplify heat through thermal storage, reduced ventilation, increased humidity, and diminished nighttime cooling.
| Decade | Relative Persistence Index |
|---|---|
| 1990s | 1.0 |
| 2000s | 1.5 |
| 2010s | 2.5 |
| 2020s | 4.5 |
The largest changes occur at night. Many cities now experience clusters of extremely warm nights that were rare or virtually absent during the late twentieth century.
5. Seasonal Expansion
Heat seasons are becoming longer. Heat waves arrive earlier in the year and persist later into autumn, increasing cumulative exposure.
| Decade | Relative Seasonal Exposure Index |
|---|---|
| 1990s | 1.0 |
| 2000s | 1.2 |
| 2010s | 1.8 |
| 2020s | 2.7 |
Even if heat-wave intensity remained unchanged, a longer season increases total exposure and cumulative risk.
Composite Extreme Heat Index
Combining these indicators yields a composite measure of changing extreme heat behavior.
| Decade | Composite Index |
|---|---|
| 1990s | 1.0 |
| 2000s | 1.4 |
| 2010s | 2.2 |
| 2020s | 3.8 |
Evidence for Temperature Jerk
The most important observation is that all five indicators exhibit the same pattern:
- Increase from the 1990s to the 2000s.
- Larger increase from the 2000s to the 2010s.
- Even larger increase from the 2010s to the 2020s.
In mathematical terms, the first derivative remains positive:
dI/dt > 0
More importantly, the second derivative appears positive:
d²I/dt² > 0
For several indicators—including wet-bulb exposure, heat-wave duration, warm-night frequency, and urban heat persistence—the data increasingly suggest positive jerk:
d³I/dt³ > 0
Taken together, these observations suggest that extreme heat behavior may represent one of the clearest manifestations of climate jerk currently observable in the Earth system. Average temperatures continue to rise, but the tails of the temperature distribution, the persistence of extreme heat, and the loss of nighttime cooling appear to be changing even faster than the mean itself.
- Singularity: Public Access Version (6th-grade level)
- Singularity: Easy Version (~8th–10th grade level)
- Singularity: Journal-Ready Version (~college graduate level)
Easy-to-Read References
-
Singularity: The Runaway Guitar Feedback Scenario
Definitions of: runaway climate indicator feedbacks, runaway greenhouse effect, Hothouse Earth, Venus Syndrome, and singularity - The Runaway Train Scenario
- Example: Amazon Rainforest Dieback
References
IPCC (2023). Sixth Assessment Report
Lenton, T. et al. (2019). Climate tipping points
Hansen, J. et al. (2016). Ice melt and sea level rise
NOAA National Centers for Environmental Information. Billion-Dollar Weather and Climate Disasters Database
- A Unified Energetics Framework for Accelerating Climate Change: From Radiative Forcing to Drag Physics — Brouse and Mukherjee (March 2026)
- Emergent Climate Dynamics: The Nonlinear Acceleration of Climate Impacts — Brouse and Mukherjee (March 2026)
- The Third Derivative and Climate Acceleration: Why Change Is Increasing Faster Over Time — Brouse (March 2026)
- Case Study: Climate Coupling and Hidden Economic Costs — Brouse (March 2026)
- How Not to Be a Jerk: Third Derivatives and the Singularity of Climate Change — Brouse and Mukherjee (March 2026)
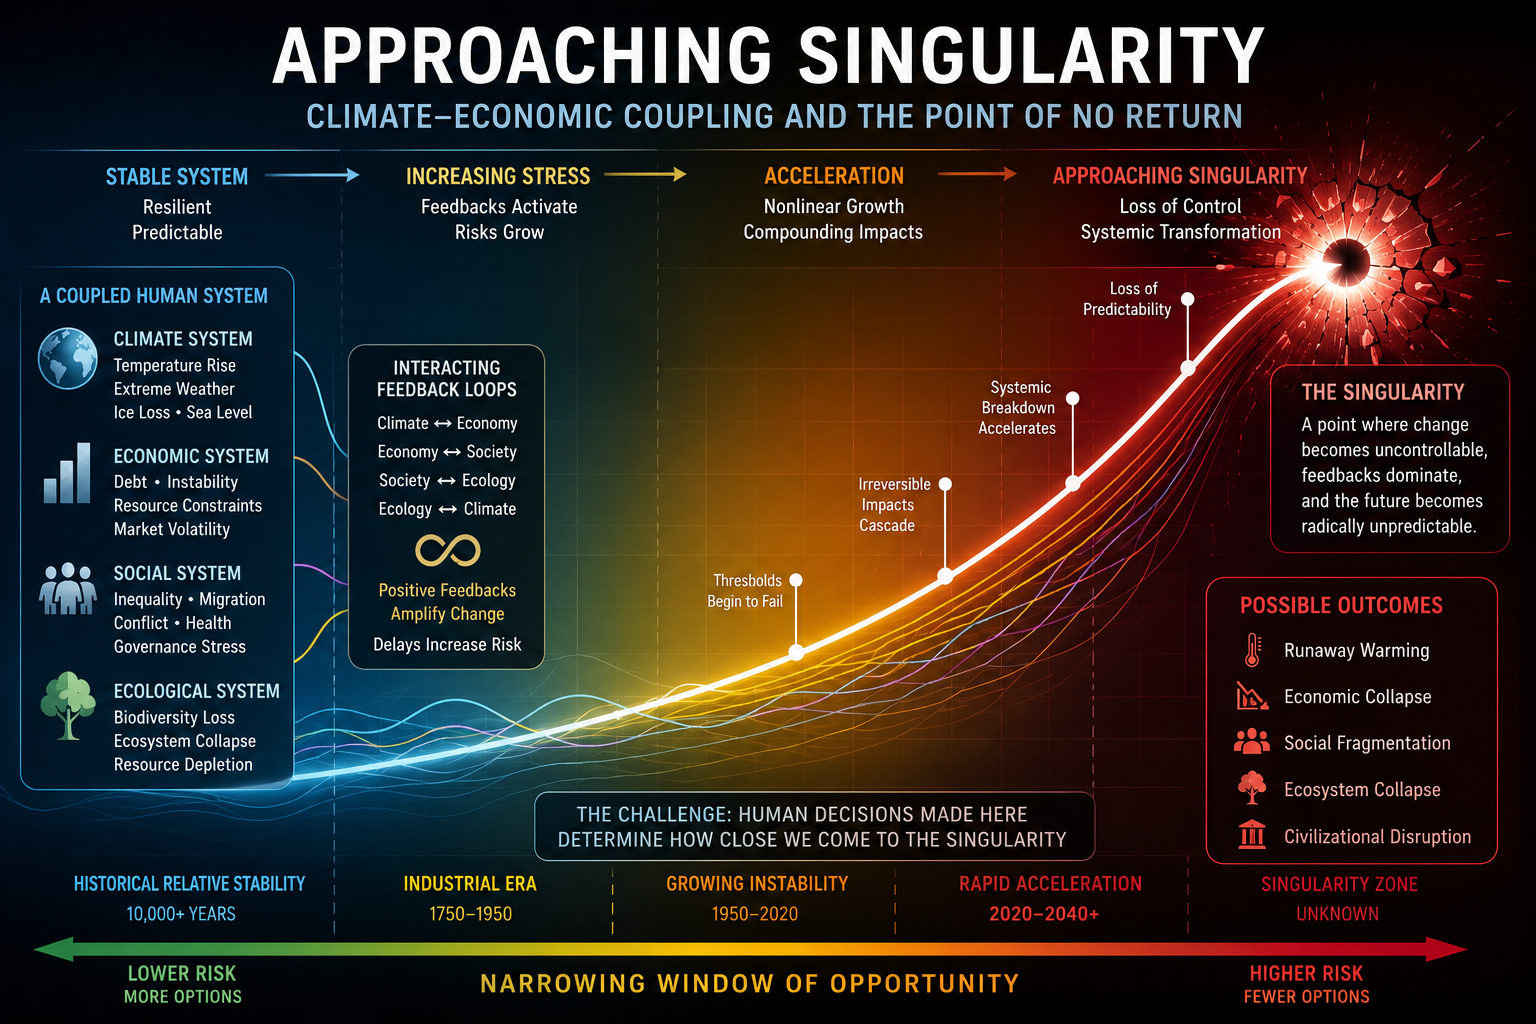
* Our probabilistic, ensemble-based climate model — which incorporates complex socio-economic and ecological feedback loops within a dynamic, nonlinear system — projects that global temperatures are becoming unsustainable this century. This far exceeds earlier estimates of a 4°C rise over the next thousand years, highlighting a dramatic acceleration in global warming. We are now entering a phase of compound, cascading collapse, where climate, ecological, and societal systems destabilize through interlinked, self-reinforcing feedback loops.
Tipping points and feedback loops drive the acceleration of climate change. When one tipping point is toppled and triggers others, the cascading collapse is known as the Domino Effect.
Further References
Primary Sources
Brouse, D., & Mukherjee, S. (2026). 2026: Confirmation of Nonlinear Climate Acceleration in the Arctic–North Atlantic System. Membrane.com Climate Science Series. Retrieved from http://membrane.com/global_warming/Nonlinear-Climate-Acceleration.html
Brouse, D., & Mukherjee, S. (2026). Amazon Rainforest Dieback: Emerging Risks, Feedback Loops, and Scenario-Based Projections. Membrane.com Climate Science Series. Retrieved from http://membrane.com/global_warming/Amazon-Dieback.html
Brouse, D., & Mukherjee, S. (2026). A Unified Energetics Framework for Accelerating Climate Change: From Radiative Forcing to Drag Physics. Membrane.com Climate Science Series. Retrieved from http://membrane.com/global_warming/Climate-Change-Math-and-Physics.html
Brouse, D., & Mukherjee, S. (2026). Is Climate Change on a Runaway Train?. Membrane.com Climate Science Series. Retrieved from http://membrane.com/global_warming/Climate-Runaway-Train-Scenario.html
Hansen and Colleagues
Hansen, J. E. (2025). Runaway Climate: The Point of No Return. Climate Science, Awareness and Action Newsletter. Retrieved from https://mailchi.mp/caa/runaway-climate-the-point-of-no-return
Hansen, J. E., Kharecha, P., Morgan, P., et al. (2025). Global Warming Acceleration: Impact on Sea Ice. Retrieved from http://membrane.com/global_warming/notes/SeaIce-Acceleration-02April2025.pdf
Hansen, J. E., Kharecha, P., & Morgan, P. (2025). Warning! This "Colorful Chart" is Censored by IPCC. Retrieved from http://membrane.com/global_warming/notes/Hansen-Acceleration-2025.pdf
Peer-Reviewed Literature
Baldwin, M. P., et al. (2021). Climate system variability and atmospheric circulation changes. Reviews of Geophysics, 59(1).
Caesar, L., McCarthy, G. D., Thornalley, D. J. R., Cahill, N., & Rahmstorf, S. (2021). Current Atlantic Meridional Overturning Circulation weakest in the last millennium. Nature Geoscience, 14, 118–120.
Francis, J. A., & Vavrus, S. J. (2012). Evidence linking Arctic amplification to extreme weather in mid-latitudes. Geophysical Research Letters, 39(6).
IMBIE Team. (2020). Mass balance of the Greenland Ice Sheet from 1992–2018. Nature, 579, 233–239.
Khan, S. A., Aschwanden, A., Bjørk, A. A., et al. (2016). Greenland ice sheet mass balance and sea-level contribution. Science Advances, 2(11), e1600931.
Mann, M. E., Rahmstorf, S., Kornhuber, K., et al. (2017). Influence of anthropogenic climate change on planetary wave resonance and extreme weather events. Scientific Reports, 7, 45242.
Overland, J. E., Hanna, E., Hanssen-Bauer, I., et al. (2019). The urgency of Arctic climate change. Nature Climate Change, 9, 181–184.
Serreze, M. C., & Barry, R. G. (2011). Processes and impacts of Arctic amplification. Global and Planetary Change, 77(1–2), 85–96.
Svennevig, K., et al. (2023). Climate-driven slope failures and cryosphere destabilization in Greenland. Geophysical Research Letters, 50.
Major Assessments and Data Sources
IPCC. (2021). Climate Change 2021: The Physical Science Basis. Contribution of Working Group I to the Sixth Assessment Report. Cambridge University Press.
NASA. (2025). Global Mean Sea Level from Satellite Altimetry. National Aeronautics and Space Administration. Retrieved from https://sealevel.nasa.gov
National Oceanic and Atmospheric Administration (NOAA). (2025). Climate Indicators and Global Monitoring Data. Retrieved from https://www.noaa.gov
World Meteorological Organization (WMO). (2024). State of the Global Climate 2024. Geneva, Switzerland.
Copernicus Climate Change Service (C3S). (2025). Global Climate Highlights. European Union.
Additional Recent Literature Relevant to Nonlinear Climate Dynamics
Armstrong McKay, D. I., Staal, A., Abrams, J. F., et al. (2022). Exceeding 1.5°C global warming could trigger multiple climate tipping points. Science, 377(6611), eabn7950.
Boers, N. (2021). Observation-based early-warning signals for a collapse of the Atlantic Meridional Overturning Circulation. Nature Climate Change, 11, 680–688.
Lenton, T. M., Rockström, J., Gaffney, O., et al. (2019). Climate tipping points—too risky to bet against. Nature, 575, 592–595.
Ripple, W. J., Wolf, C., Gregg, J. W., et al. (2024). The 2024 State of the Climate Report: Perilous Times on Planet Earth. BioScience.
Steffen, W., Rockström, J., Richardson, K., et al. (2018). Trajectories of the Earth System in the Anthropocene. Proceedings of the National Academy of Sciences, 115(33), 8252–8259.
Richardson, K., Steffen, W., Lucht, W., et al. (2023). Earth beyond six of nine planetary boundaries. Science Advances, 9(37), eadh2458.