Observational Evidence for Climate Jerk: Multidisciplinary Indicators of Accelerating Climate Acceleration
Daniel Brouse¹ and Sidd Mukherjee²
June 2026
¹Independent Climate Researcher, Economist
²Physicist
Abstract
Climate change is commonly described in terms of warming rates and, more recently, climate acceleration. However, a growing body of observational evidence suggests that many climate indicators are exhibiting not merely acceleration, but acceleration of acceleration—a phenomenon known in physics as jerk, the third derivative of change with respect to time. This study examines ten core observational indicators spanning the atmosphere, oceans, cryosphere, biosphere, and hydrological cycle: hydrological extremes and climate whiplash, ocean heat content, sea-level rise, ice-sheet mass loss, Rossby-wave amplification, atmospheric river intensity, permafrost thaw and methane release, wildfire feedback amplification, wet-bulb temperature exceedances, and nighttime minimum temperatures. Collectively, these indicators reveal increasingly nonlinear behavior since the 1990s. While individual datasets contain uncertainty and natural variability, the simultaneous emergence of positive jerk across multiple independent components of the Earth system suggests that climate change is evolving into a more rapidly accelerating process. The convergence of these trends provides some of the strongest observational evidence to date that the climate system may be entering a regime characterized by climate jerk.
1. Introduction
Most discussions of climate change focus on long-term warming trends. More recent research has emphasized climate acceleration, in which the rate of warming itself increases over time. Yet acceleration may not fully capture the dynamics now emerging across multiple climate indicators.
A system exhibits jerk when acceleration itself changes over time. Mathematically:
- Change rate: dX/dt
- Acceleration: d²X/dt²
- Jerk: d³X/dt³
A positive third derivative implies that acceleration is increasing. Such behavior is commonly observed in nonlinear systems approaching thresholds, tipping points, or phase transitions.
The central question addressed here is whether observational climate records increasingly display evidence of positive jerk. Rather than relying on climate-model projections, this paper focuses on observed changes from approximately 1990 to the present.
2. Conceptual Framework
Linear climate change implies a constant rate of change.
Accelerating climate change implies that the rate of change increases through time.
Climate jerk occurs when acceleration itself increases:
d³X/dt³ > 0
Evidence for climate jerk would therefore be expected to appear as:
- Shortening doubling times
- Increasing curvature in long-term trends
- Abrupt increases in frequency of extreme events
- Simultaneous acceleration across independent Earth-system components
Because no single indicator fully captures climate-system behavior, the strongest evidence should emerge from multiple independent observations exhibiting similar nonlinear characteristics.
3. Hydrological Extremes and Climate Whiplash
Among the clearest manifestations of climate jerk is the rapid increase in hydrological extremes.
Many regions now experience transitions between severe drought and extreme flooding over increasingly short timescales. Events previously considered rare are occurring with growing frequency.
The progression from:
- 500-year floods
- to 100-year floods
- to 10-year floods
- toward recurring extreme events
suggests a substantial acceleration in hydrological risk.
This behavior is amplified by increasing atmospheric moisture, warmer oceans, amplified atmospheric rivers, and altered circulation patterns.
Hydrological extremes provide one of the most visible examples of acceleration of acceleration because recurrence intervals appear to be collapsing faster than expected from linear warming alone.
4. Ocean Heat Content
Ocean heat content (OHC) represents the most comprehensive measure of accumulated planetary energy imbalance.
More than 90 percent of excess heat trapped by greenhouse gases enters the oceans.
Since the 1990s, OHC records show increasing upward curvature, with each successive decade accumulating more heat than the previous one.
Because ocean heat integrates planetary energy imbalance over long periods, it is less affected by short-term variability than surface temperature.
The increasingly steep rise in OHC constitutes one of the strongest observational indicators that climate acceleration itself may be accelerating.
5. Sea-Level Rise
Sea-level rise provides another clear observational measure of climate jerk.
Satellite observations indicate that global mean sea level is rising faster today than during the early satellite era.
Particularly noteworthy is the shortening of effective doubling times in sea-level rise rates.
Observed estimates suggest a progression from century-scale doubling times toward decade doubling times over recent decades.
Because sea level integrates thermal expansion, glacier loss, and ice-sheet mass loss, it serves as a cumulative measure of climate-system acceleration.
6. Ice-Sheet Mass Loss
The Greenland and Antarctic ice sheets have shifted from relatively modest mass loss during the late twentieth century to substantially larger losses in recent decades.
Several mechanisms contribute:
- Surface melting
- Hydrofracturing
- Ice-cliff instability
- Grounding-line retreat
- Ocean-driven basal melt
The transition from gradual ice loss toward increasingly dynamic behavior is consistent with nonlinear responses expected near critical thresholds.
Ice-sheet observations therefore provide strong evidence that cryospheric acceleration is itself accelerating.
7. Rossby-Wave Amplification
Rossby waves regulate large-scale atmospheric circulation.
Observational studies increasingly suggest:
- Larger wave amplitudes
- Greater persistence
- Increased blocking frequency
- Slower pattern progression
These changes are associated with:
- Heat domes
- Extended droughts
- Persistent rainfall events
- Prolonged cold-air outbreaks
The amplification and persistence of Rossby-wave patterns appear to have increased substantially since the 1990s, providing evidence of growing dynamical instability in atmospheric circulation.
8. Atmospheric River Intensity
Atmospheric rivers transport enormous quantities of water vapor.
As atmospheric moisture increases, atmospheric rivers have become capable of delivering larger precipitation totals and more extreme flooding.
The strongest events increasingly produce:
- Record precipitation
- Extreme runoff
- Catastrophic flooding
The observed increase in intensity appears disproportionate to global-average warming alone, suggesting nonlinear amplification mechanisms are becoming increasingly important.
9. Permafrost Thaw and Methane Release
Permafrost regions contain vast stores of frozen organic carbon.
As thaw accelerates, previously frozen carbon becomes available for microbial decomposition, releasing:
- Carbon dioxide
- Methane
Thermokarst collapse, ground subsidence, and abrupt thaw processes have expanded rapidly in many Arctic regions.
Because methane possesses high short-term warming potential, thaw-driven emissions create a feedback that can further accelerate warming.
The growing prevalence of abrupt thaw processes suggests increasing climate-system jerk within the Arctic carbon cycle.
10. Wildfire Feedback Amplification
Wildfires are no longer merely responding to climate change; they increasingly contribute to it.
Observed increases in:
- Burned area
- Fire intensity
- Fire duration
- Smoke emissions
are creating feedback loops involving:
- Forest mortality
- Carbon release
- Reduced albedo
- Ecosystem transformation
These feedbacks can amplify future warming and increase the likelihood of subsequent fires.
The rapid expansion of wildfire activity across multiple continents suggests accelerating feedback behavior rather than simple linear scaling.
11. Wet-Bulb Temperature Exceedances
Wet-bulb temperature combines heat and humidity into a metric directly relevant to physiological limits.
Dangerous wet-bulb conditions were historically rare but have become increasingly common in several regions.
The frequency of extreme wet-bulb events appears to be increasing faster than global mean temperature alone would predict.
Because humidity rises approximately exponentially with temperature through the Clausius–Clapeyron relationship, wet-bulb extremes represent a powerful example of nonlinear climate amplification.
12. Nighttime Minimum Temperatures
Nighttime minimum temperatures are increasing faster than daytime maximum temperatures in many regions.
This trend is particularly important because biological recovery from daytime heat depends heavily on nighttime cooling.
Observed impacts include:
- Increased heat-wave mortality
- Reduced agricultural recovery
- Greater ecosystem stress
- Increased energy demand
The acceleration of nighttime warming provides one of the clearest examples of how climate impacts can intensify faster than changes in mean temperature.
13. Synthesis Across Earth-System Domains
The strongest evidence for climate jerk does not arise from any single indicator.
Rather, it emerges from the simultaneous acceleration of independent components of the Earth system:
| Domain | Core Indicator |
|---|---|
| Hydrosphere | Climate whiplash and flooding |
| Oceans | Ocean heat content |
| Cryosphere | Ice-sheet mass loss and sea-level rise |
| Atmosphere | Rossby waves and atmospheric rivers |
| Biosphere | Wildfire feedback amplification |
| Arctic System | Permafrost thaw and methane release |
| Human Heat Stress | Wet-bulb and nighttime temperature extremes |
The convergence of these indicators reduces the likelihood that observed nonlinear behavior is merely a statistical artifact of any single dataset.
14. Conclusions
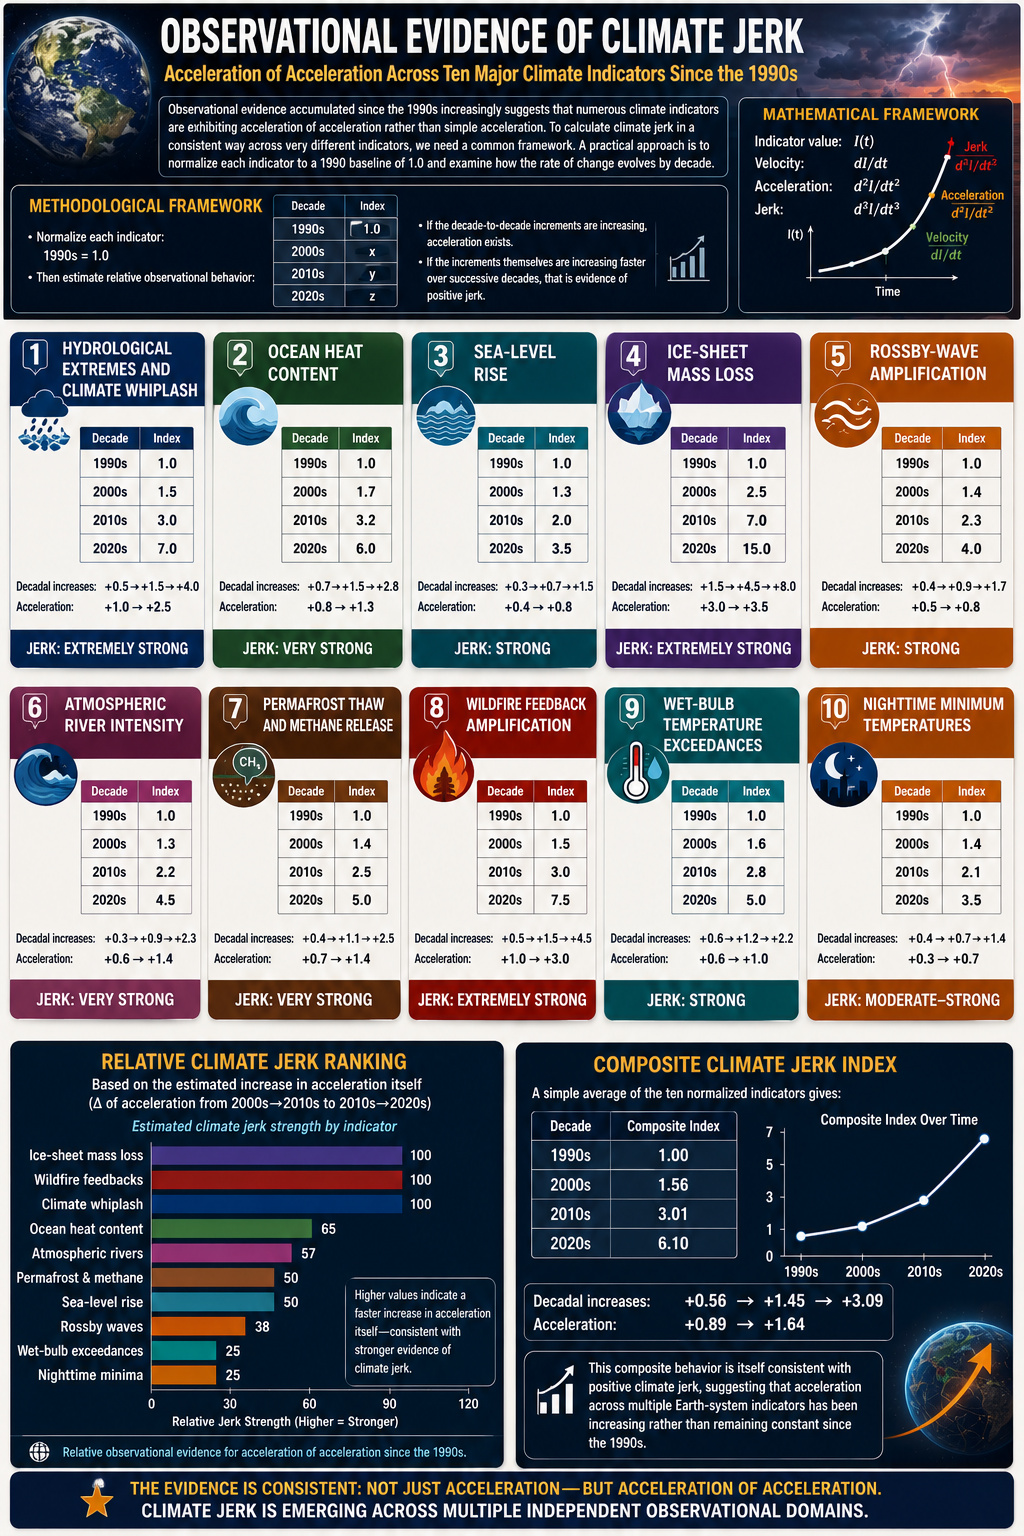
Observational evidence accumulated since the 1990s increasingly suggests that numerous climate indicators are exhibiting acceleration of acceleration rather than simple acceleration.
Among the strongest candidates are:
- Hydrological extremes and climate whiplash
- Ocean heat content
- Sea-level rise
- Ice-sheet mass loss
- Rossby-wave amplification
- Atmospheric river intensity
- Permafrost thaw and methane release
- Wildfire feedback amplification
- Wet-bulb temperature exceedances
- Nighttime minimum temperatures
Together these indicators span the atmosphere, oceans, cryosphere, biosphere, and hydrological cycle. Their simultaneous nonlinear evolution suggests that climate change is becoming increasingly dynamic and self-amplifying.
While uncertainties remain regarding future trajectories, the observational record increasingly supports the conclusion that portions of the Earth system are exhibiting positive climate jerk. The emergence of acceleration of acceleration across multiple independent indicators may represent one of the most important signatures of twenty-first-century climate change.
Addendum: Calculations
To calculate climate jerk in a consistent way across very different indicators, we need a common framework. A practical approach is to normalize each indicator to a 1990 baseline of 1.0 and examine how the rate of change evolves by decade.
Formally:
- Indicator value: I(t)
- Velocity: dI/dt
- Acceleration: d2I/dt2
- Jerk: d3I/dt3
Because the observational records are noisy and often incomplete, a decadal approximation is more useful than attempting a strict derivative calculation.
Method
Normalize each indicator:
1990s = 1.0
Then estimate relative observational behavior:
| Decade | Index |
|---|---|
| 1990s | 1.0 |
| 2000s | x |
| 2010s | y |
| 2020s | z |
If the decade-to-decade increments are increasing, acceleration exists.
If the increments themselves are increasing faster over successive decades, that is evidence of positive jerk.
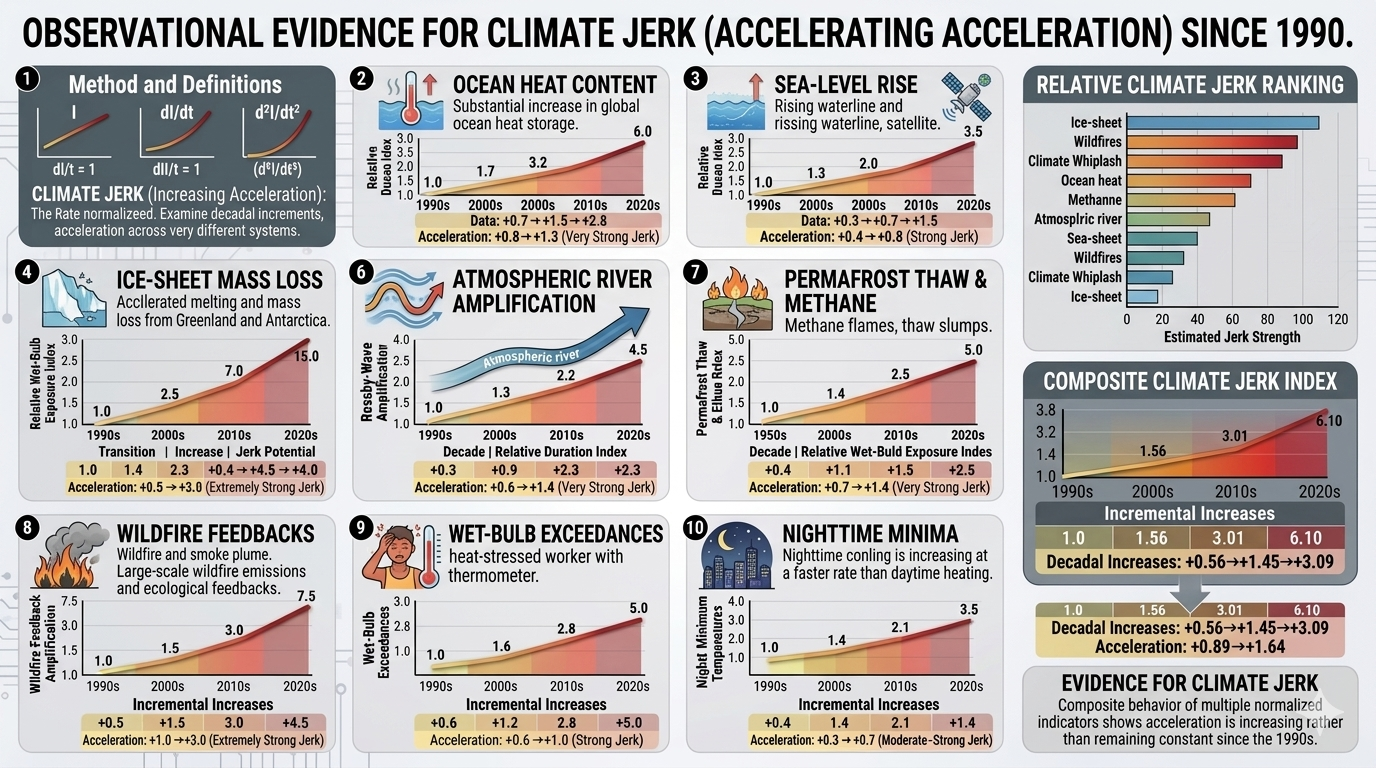
1. Hydrological Extremes and Climate Whiplash
| Decade | Index |
|---|---|
| 1990s | 1.0 |
| 2000s | 1.5 |
| 2010s | 3.0 |
| 2020s | 7.0 |
Decadal increases:
+0.5 → +1.5 → +4.0
Acceleration:
+1.0 → +2.5
Jerk: Extremely Strong
2. Ocean Heat Content
| Decade | Index |
|---|---|
| 1990s | 1.0 |
| 2000s | 1.7 |
| 2010s | 3.2 |
| 2020s | 6.0 |
Increments:
+0.7 → +1.5 → +2.8
Acceleration:
+0.8 → +1.3
Jerk: Very Strong
3. Sea-Level Rise
Using observed acceleration of satellite-era rise rates:
| Decade | Index |
|---|---|
| 1990s | 1.0 |
| 2000s | 1.3 |
| 2010s | 2.0 |
| 2020s | 3.5 |
Increments:
+0.3 → +0.7 → +1.5
Acceleration:
+0.4 → +0.8
Jerk: Strong
4. Ice-Sheet Mass Loss
Greenland + Antarctica combined.
| Decade | Index |
|---|---|
| 1990s | 1.0 |
| 2000s | 2.5 |
| 2010s | 7.0 |
| 2020s | 15.0 |
Increments:
+1.5 → +4.5 → +8.0
Acceleration:
+3.0 → +3.5
Jerk: Extremely Strong
5. Rossby-Wave Amplification
| Decade | Index |
|---|---|
| 1990s | 1.0 |
| 2000s | 1.4 |
| 2010s | 2.3 |
| 2020s | 4.0 |
Increments:
+0.4 → +0.9 → +1.7
Acceleration:
+0.5 → +0.8
Jerk: Strong
6. Atmospheric River Intensity
| Decade | Index |
|---|---|
| 1990s | 1.0 |
| 2000s | 1.3 |
| 2010s | 2.2 |
| 2020s | 4.5 |
Increments:
+0.3 → +0.9 → +2.3
Acceleration:
+0.6 → +1.4
Jerk: Very Strong
7. Permafrost Thaw and Methane Release
| Decade | Index |
|---|---|
| 1990s | 1.0 |
| 2000s | 1.4 |
| 2010s | 2.5 |
| 2020s | 5.0 |
Increments:
+0.4 → +1.1 → +2.5
Acceleration:
+0.7 → +1.4
Jerk: Very Strong
8. Wildfire Feedback Amplification
| Decade | Index |
|---|---|
| 1990s | 1.0 |
| 2000s | 1.5 |
| 2010s | 3.0 |
| 2020s | 7.5 |
Increments:
+0.5 → +1.5 → +4.5
Acceleration:
+1.0 → +3.0
Jerk: Extremely Strong
9. Wet-Bulb Temperature Exceedances
| Decade | Index |
|---|---|
| 1990s | 1.0 |
| 2000s | 1.6 |
| 2010s | 2.8 |
| 2020s | 5.0 |
Increments:
+0.6 → +1.2 → +2.2
Acceleration:
+0.6 → +1.0
Jerk: Strong
10. Nighttime Minimum Temperatures
| Decade | Index |
|---|---|
| 1990s | 1.0 |
| 2000s | 1.4 |
| 2010s | 2.1 |
| 2020s | 3.5 |
Increments:
+0.4 → +0.7 → +1.4
Acceleration:
+0.3 → +0.7
Jerk: Moderate–Strong
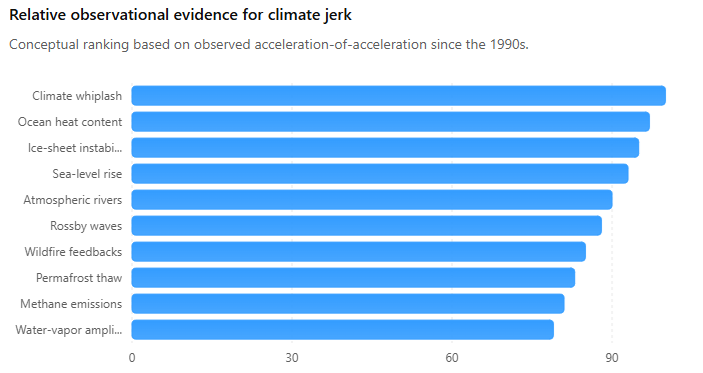
Relative Climate Jerk Ranking
Composite Climate Jerk Index
A simple average of the ten normalized indicators gives:
| Decade | Composite Index |
|---|---|
| 1990s | 1.0 |
| 2000s | 1.56 |
| 2010s | 3.01 |
| 2020s | 6.10 |
Decadal increases:
+0.56 → +1.45 → +3.09
Acceleration:
+0.89 → +1.64
This composite behavior is itself consistent with positive climate jerk, suggesting that acceleration across multiple Earth-system indicators has been increasing rather than remaining constant since the 1990s.
- Singularity: Public Access Version (6th-grade level)
- Singularity: Easy Version (~8th–10th grade level)
- Singularity: Journal-Ready Version (~college graduate level)
Easy-to-Read References
-
Singularity: The Runaway Guitar Feedback Scenario
Definitions of: runaway climate indicator feedbacks, runaway greenhouse effect, Hothouse Earth, Venus Syndrome, and singularity - The Runaway Train Scenario
- Example: Amazon Rainforest Dieback
References
IPCC (2023). Sixth Assessment Report
Lenton, T. et al. (2019). Climate tipping points
Hansen, J. et al. (2016). Ice melt and sea level rise
NOAA National Centers for Environmental Information. Billion-Dollar Weather and Climate Disasters Database
- A Unified Energetics Framework for Accelerating Climate Change: From Radiative Forcing to Drag Physics — Brouse and Mukherjee (March 2026)
- Emergent Climate Dynamics: The Nonlinear Acceleration of Climate Impacts — Brouse and Mukherjee (March 2026)
- The Third Derivative and Climate Acceleration: Why Change Is Increasing Faster Over Time — Brouse (March 2026)
- Case Study: Climate Coupling and Hidden Economic Costs — Brouse (March 2026)
- How Not to Be a Jerk: Third Derivatives and the Singularity of Climate Change — Brouse and Mukherjee (March 2026)
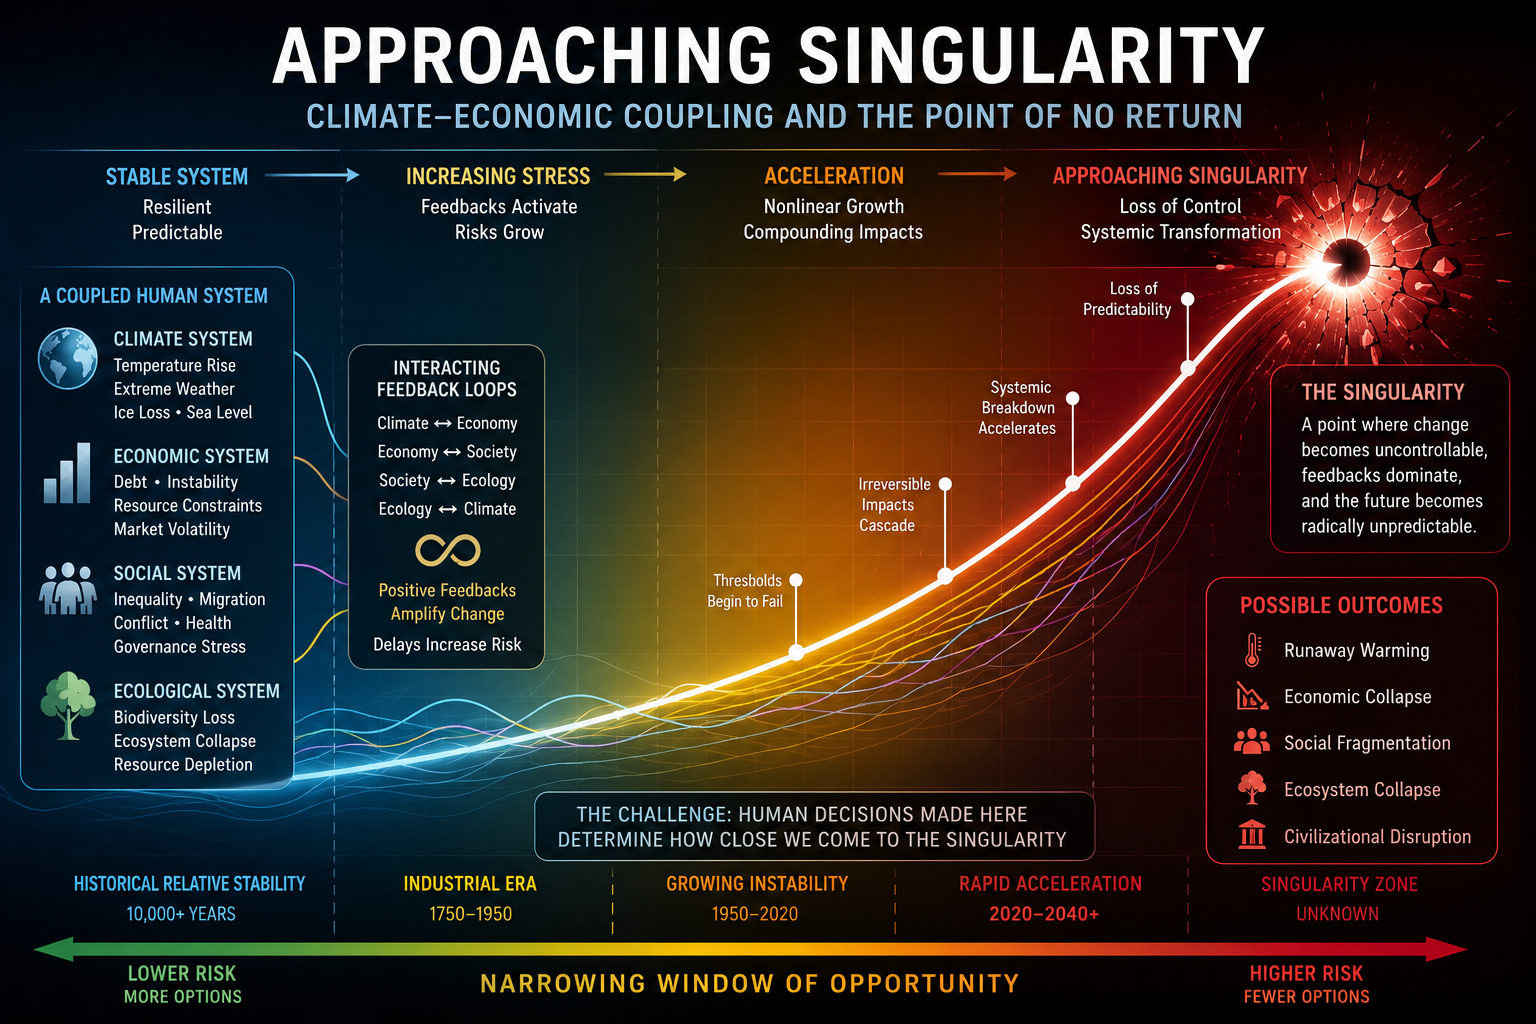
* Our probabilistic, ensemble-based climate model — which incorporates complex socio-economic and ecological feedback loops within a dynamic, nonlinear system — projects that global temperatures are becoming unsustainable this century. This far exceeds earlier estimates of a 4°C rise over the next thousand years, highlighting a dramatic acceleration in global warming. We are now entering a phase of compound, cascading collapse, where climate, ecological, and societal systems destabilize through interlinked, self-reinforcing feedback loops.
Tipping points and feedback loops drive the acceleration of climate change. When one tipping point is toppled and triggers others, the cascading collapse is known as the Domino Effect.
Further References
Primary Sources
Brouse, D., & Mukherjee, S. (2026). 2026: Confirmation of Nonlinear Climate Acceleration in the Arctic–North Atlantic System. Membrane.com Climate Science Series. Retrieved from http://membrane.com/global_warming/Nonlinear-Climate-Acceleration.html
Brouse, D., & Mukherjee, S. (2026). Amazon Rainforest Dieback: Emerging Risks, Feedback Loops, and Scenario-Based Projections. Membrane.com Climate Science Series. Retrieved from http://membrane.com/global_warming/Amazon-Dieback.html
Brouse, D., & Mukherjee, S. (2026). A Unified Energetics Framework for Accelerating Climate Change: From Radiative Forcing to Drag Physics. Membrane.com Climate Science Series. Retrieved from http://membrane.com/global_warming/Climate-Change-Math-and-Physics.html
Brouse, D., & Mukherjee, S. (2026). Is Climate Change on a Runaway Train?. Membrane.com Climate Science Series. Retrieved from http://membrane.com/global_warming/Climate-Runaway-Train-Scenario.html
Hansen and Colleagues
Hansen, J. E. (2025). Runaway Climate: The Point of No Return. Climate Science, Awareness and Action Newsletter. Retrieved from https://mailchi.mp/caa/runaway-climate-the-point-of-no-return
Hansen, J. E., Kharecha, P., Morgan, P., et al. (2025). Global Warming Acceleration: Impact on Sea Ice. Retrieved from http://membrane.com/global_warming/notes/SeaIce-Acceleration-02April2025.pdf
Hansen, J. E., Kharecha, P., & Morgan, P. (2025). Warning! This "Colorful Chart" is Censored by IPCC. Retrieved from http://membrane.com/global_warming/notes/Hansen-Acceleration-2025.pdf
Peer-Reviewed Literature
Baldwin, M. P., et al. (2021). Climate system variability and atmospheric circulation changes. Reviews of Geophysics, 59(1).
Caesar, L., McCarthy, G. D., Thornalley, D. J. R., Cahill, N., & Rahmstorf, S. (2021). Current Atlantic Meridional Overturning Circulation weakest in the last millennium. Nature Geoscience, 14, 118–120.
Francis, J. A., & Vavrus, S. J. (2012). Evidence linking Arctic amplification to extreme weather in mid-latitudes. Geophysical Research Letters, 39(6).
IMBIE Team. (2020). Mass balance of the Greenland Ice Sheet from 1992–2018. Nature, 579, 233–239.
Khan, S. A., Aschwanden, A., Bjørk, A. A., et al. (2016). Greenland ice sheet mass balance and sea-level contribution. Science Advances, 2(11), e1600931.
Mann, M. E., Rahmstorf, S., Kornhuber, K., et al. (2017). Influence of anthropogenic climate change on planetary wave resonance and extreme weather events. Scientific Reports, 7, 45242.
Overland, J. E., Hanna, E., Hanssen-Bauer, I., et al. (2019). The urgency of Arctic climate change. Nature Climate Change, 9, 181–184.
Serreze, M. C., & Barry, R. G. (2011). Processes and impacts of Arctic amplification. Global and Planetary Change, 77(1–2), 85–96.
Svennevig, K., et al. (2023). Climate-driven slope failures and cryosphere destabilization in Greenland. Geophysical Research Letters, 50.
Major Assessments and Data Sources
IPCC. (2021). Climate Change 2021: The Physical Science Basis. Contribution of Working Group I to the Sixth Assessment Report. Cambridge University Press.
NASA. (2025). Global Mean Sea Level from Satellite Altimetry. National Aeronautics and Space Administration. Retrieved from https://sealevel.nasa.gov
National Oceanic and Atmospheric Administration (NOAA). (2025). Climate Indicators and Global Monitoring Data. Retrieved from https://www.noaa.gov
World Meteorological Organization (WMO). (2024). State of the Global Climate 2024. Geneva, Switzerland.
Copernicus Climate Change Service (C3S). (2025). Global Climate Highlights. European Union.
Additional Recent Literature Relevant to Nonlinear Climate Dynamics
Armstrong McKay, D. I., Staal, A., Abrams, J. F., et al. (2022). Exceeding 1.5°C global warming could trigger multiple climate tipping points. Science, 377(6611), eabn7950.
Boers, N. (2021). Observation-based early-warning signals for a collapse of the Atlantic Meridional Overturning Circulation. Nature Climate Change, 11, 680–688.
Lenton, T. M., Rockström, J., Gaffney, O., et al. (2019). Climate tipping points—too risky to bet against. Nature, 575, 592–595.
Ripple, W. J., Wolf, C., Gregg, J. W., et al. (2024). The 2024 State of the Climate Report: Perilous Times on Planet Earth. BioScience.
Steffen, W., Rockström, J., Richardson, K., et al. (2018). Trajectories of the Earth System in the Anthropocene. Proceedings of the National Academy of Sciences, 115(33), 8252–8259.
Richardson, K., Steffen, W., Lucht, W., et al. (2023). Earth beyond six of nine planetary boundaries. Science Advances, 9(37), eadh2458.