Calculating the Rate of Climate Acceleration in a Nonlinear Earth System
Daniel Brouse¹ and Sidd Mukherjee²
June 2026
¹Independent Climate Researcher, Economist
²Physicist
Introduction
Recent questions regarding climate change, acceleration, and tipping points have prompted a more detailed examination of the underlying framework. In particular, the question—“Why not include temperature?”—led to a clarification of the role of global mean temperature in predictive models, and why no single variable is sufficient to characterize system behavior.
This in turn motivates a broader discussion of why many traditional predictive approaches are becoming less reliable as the climate system exhibits increasingly nonlinear dynamics, including feedback amplification, tipping point effects, and higher-order (jerk-like) behavior.
Nonlinear Climate Acceleration
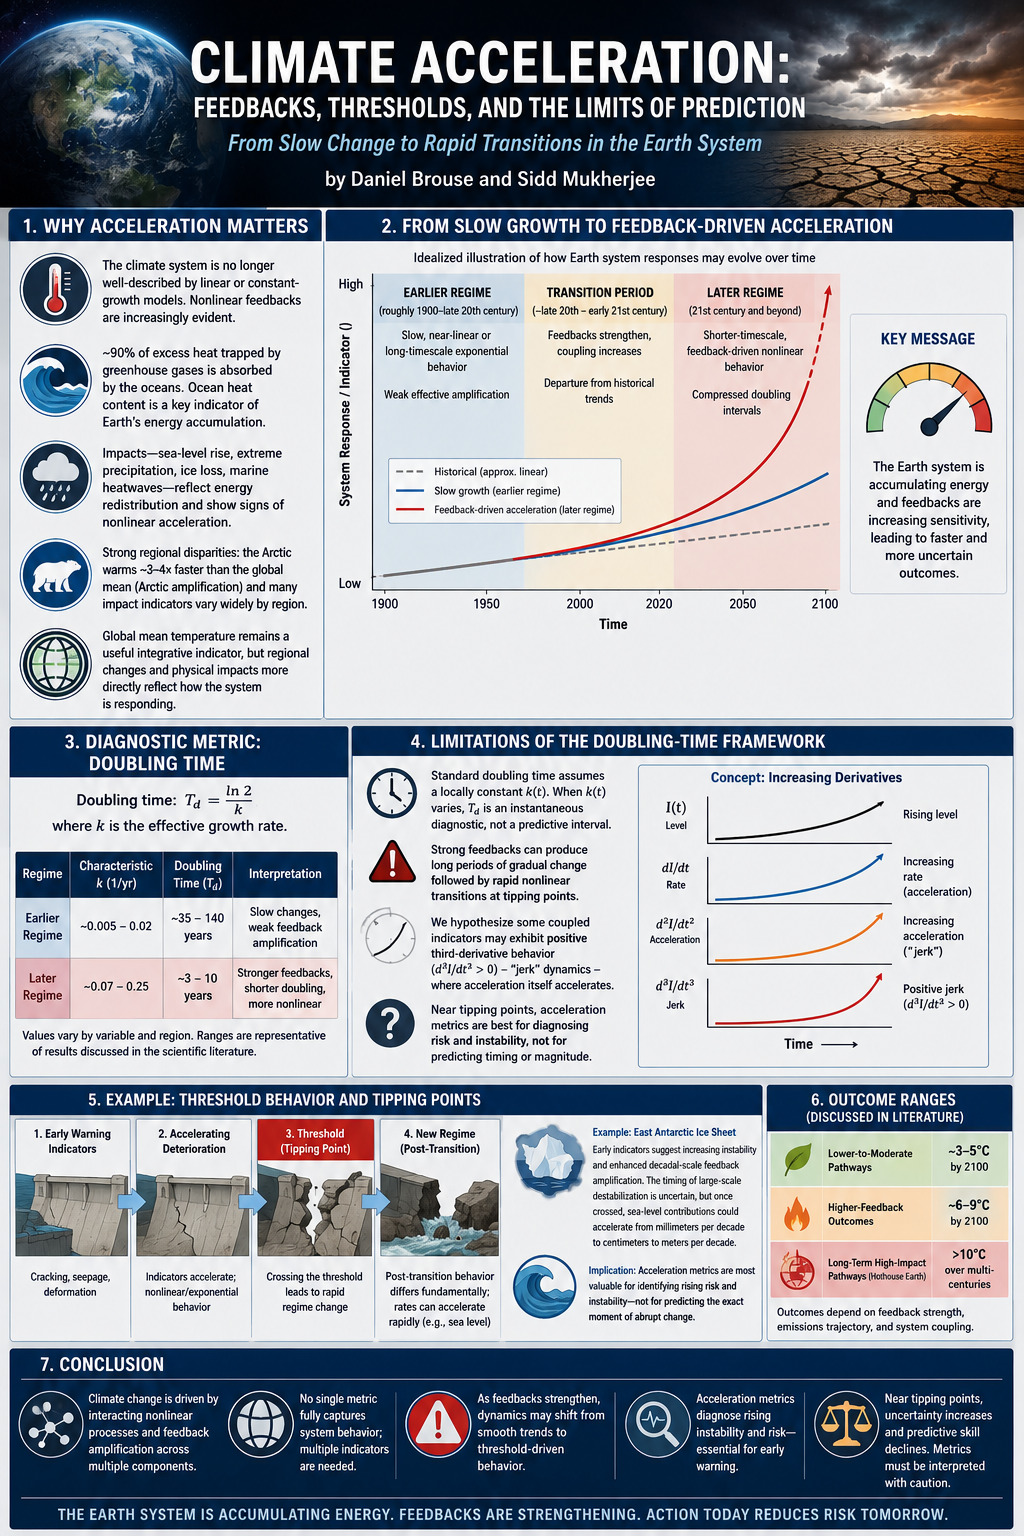
Estimating the rate of climate change has become increasingly difficult. In the 20th century, many observed trends appeared approximately linear over short time horizons. By the 21st century, however, the influence of nonlinear feedbacks has become increasingly apparent.
Current observations suggest the climate system is no longer well-described by simple linear or constant-growth models. Instead, multiple indicators show behavior consistent with accelerating change and evolving feedback strength. In this context, higher-order effects—often described informally as “jerk” (third-derivative) behavior—may become relevant in describing system dynamics.
As climate systems approach potential tipping points, the predictive skill of historical linear extrapolation diminishes. The emphasis therefore shifts away from precise prediction of transition timing and toward identifying and mitigating the drivers of acceleration and system instability.
Global average surface temperature is an important metric, but it represents only one expression of a much larger planetary energy imbalance. Approximately 90% of excess heat trapped by anthropogenic greenhouse gases is absorbed by the oceans, making ocean heat content one of the most important indicators of Earth’s energy accumulation.
Our analysis therefore focuses on how energy is redistributed through the Earth system and the resulting physical impacts. Sea-level rise, atmospheric moisture content, extreme precipitation, ice-sheet mass loss, and marine heatwaves all reflect this energy redistribution. Many of these variables show signs of nonlinear acceleration associated with feedback processes and threshold behavior, even when global mean surface temperature increases appear more gradual.
A further caveat is that global temperature averages can obscure strong regional heterogeneity. The Arctic, for example, has warmed approximately three to four times faster than the global mean due to Arctic amplification. Similar spatial disparities are observed in ocean heat content, extreme rainfall, drought frequency, and marine heatwave intensity. In many cases, regional metrics provide more direct insight into emerging system dynamics than global averages alone.
That said, global mean temperature remains a useful integrative indicator. Depending on the method of analysis, the warming signal itself exhibits evidence of increasing rates of change over time. Across multiple datasets, the broader pattern is consistent: the Earth system is accumulating energy, and many associated responses are occurring on increasingly compressed timescales.
In summary, global temperature describes the overall magnitude of warming, while regional temperature changes and physical impact indicators more directly reflect how the climate system is responding. This motivates a focus on energy flow, feedback mechanisms, and accelerating impacts rather than reliance on a single global metric.
Methodological Framework: Climate Acceleration and Doubling Time
Because each climate variable evolves through different physical processes and timescales, no single metric fully captures climate acceleration. Ocean heat content, sea-level rise, atmospheric moisture, cryospheric loss, and temperature all provide partial but complementary information.
For this reason, we consider a simplified diagnostic framework for evaluating changes in system response rates. Early observational behavior (approximately late 20th century) was often consistent with slow, century-scale doubling behavior, corresponding to weak effective amplification over long timescales.
More recent analyses across multiple independent datasets suggest shorter characteristic timescales and stronger effective feedback amplification, on the order of multi-year to decadal-scale doubling behavior depending on the variable and region considered. This implies a transition from slow growth regimes toward faster, feedback-influenced dynamics.
In simplified terms:
- Earlier regime: slow, near-linear or long-timescale exponential behavior
- Later regime: shorter-timescale, feedback-driven nonlinear behavior with compressed doubling intervals
This does not imply uniform acceleration across all variables. Rather, it suggests increasing coupling among components of the Earth system through reinforcing feedbacks. As these feedbacks strengthen, system behavior becomes increasingly nonlinear, and outcomes become more sensitive to threshold responses—tipping points—and interactions among subsystems.
In this context, higher-end climate outcomes become less dependent on linear extrapolation and more dependent on feedback strength and system coupling.
Current ranges discussed in the scientific literature include:
- Lower-to-moderate pathways: ~3–5°C warming by 2100 under continued high emissions
- Higher-feedback outcomes: ~6–9°C under scenarios with strong reinforcing feedback contributions
- Long-term high-impact pathways: >10°C over multi-century timescales, consistent with “Hothouse Earth” frameworks
Limitations of the Doubling-Time Framework
A key mathematical limitation is that standard doubling-time formulations assume a locally constant effective growth rate, k(t), over the evaluation interval. When k(t) varies significantly over time, the resulting doubling time should be interpreted as an instantaneous diagnostic rather than a predictive interval. In that case, the doubling-time framework loses much of its predictive utility and becomes primarily descriptive of local system behavior rather than a reliable forecasting tool.
This distinction becomes critical in systems with strong feedbacks. Such systems may exhibit prolonged periods of gradual change followed by rapid nonlinear transitions once tipping points are crossed. As a result, simple extrapolation from historical trends becomes increasingly unreliable near tipping points.
We further hypothesize that some coupled climate and socioeconomic indicators may exhibit positive third-derivative behavior (d³I/dt³ > 0), sometimes referred to as “accelerating acceleration” or jerk dynamics. If valid, this implies a regime in which feedback interactions dominate system evolution and increase sensitivity to small perturbations.
Under such conditions, acceleration metrics remain useful for diagnosing system state, but their predictive capacity may decline as nonlinearities and threshold effects increase.
Example: Threshold Behavior and Tipping Points
A useful analogy is a dam approaching structural failure. Long before collapse, measurable indicators—such as cracking, seepage, and deformation—may show accelerating deterioration. These processes can often be described mathematically using nonlinear or exponential models.
However, the exact moment of structural failure is typically difficult to predict. The collapse represents a threshold transition into a new dynamical regime, in which post-collapse behavior differs fundamentally from pre-collapse trends.
Climate tipping points may behave in a similar way. For example, potential large-scale destabilization of portions of the East Antarctic Ice Sheet is associated with accelerating indicators consistent with enhanced decadal-scale feedback amplification. However, the precise timing of such transitions remains highly uncertain due to complex interacting processes.
What is more certain is that once a tipping point is crossed, system responses—such as sea-level rise—may accelerate beyond rates implied by pre-transition trends. In this sense, acceleration metrics are most useful for identifying increasing instability and risk, rather than predicting the exact timing or magnitude of abrupt transitions. In the case of the East Antarctic Ice Sheet, this could imply a shift from millimeter-per-decade sea-level contributions toward substantially higher rates on the order of centimeters to meters per decade, depending on the nature and extent of ice-sheet destabilization.
Conclusion
Climate change is increasingly characterized by interacting nonlinear processes and feedback amplification across multiple components of the Earth system. While individual metrics such as temperature, sea level, and cryospheric loss each provide partial insight, no single variable fully captures system behavior.
As feedback strength increases, climate dynamics may shift from relatively smooth trends toward more threshold-driven behavior. In this regime, uncertainty increases, particularly regarding the timing of abrupt transitions.
Acceleration metrics therefore serve as diagnostic tools for identifying rising system instability, but must be interpreted with caution when used for prediction near tipping points.
* Our probabilistic, ensemble-based climate model — which incorporates complex socio-economic and ecological feedback loops within a dynamic, nonlinear system — projects that global temperatures are becoming unsustainable this century. This far exceeds earlier estimates of a 4°C rise over the next thousand years, highlighting a dramatic acceleration in global warming. We are now entering a phase of compound, cascading collapse, where climate, ecological, and societal systems destabilize through interlinked, self-reinforcing feedback loops.
Feedback loops amplify climate change and can push interconnected Earth systems past critical tipping points. As tipping points are crossed, they can trigger additional feedback loops and destabilize other climate systems. This cascading "Domino Effect" compresses timescales, accelerates change, and increases the risk of rapid, nonlinear climate transformations.